Earlier this week there was an AP article talking about secondary scoring in the NHL. I tend to believe that the more spread of scoring you have through your lineup, the better your chances for success in the Stanley Cup Playoffs. I thought it might be a fun concept to dig into a bit on this week’s Data Dump Saturday. This will take a little exploring.
% of team scoring by the top three scorers
The first thing I want to look at is the percentage of goals scored by the top three scorers on each team. Secondary scoring in this analysis is scoring done by everyone else. There is some context missing from this type of analysis such as injuries, trades, etc. but this is just intended to be a directional exploratory analysis.
Boston appears to be the most dependent on their top three goal scorers while Detroit is the least dependent on their top three scorers.
Let us next look at the last three years’ conference final teams (highlighted) to see if there is a pattern relative to secondary scoring during the last regular seasons.
It would be foolish to draw any hard and fast conclusions based on this quick analysis, but it appears that teams that are more dependent on their top line tend to not fair well in the playoffs, nor do teams that spread scoring across their lineup.
Team Goal Scoring
An important point for context not shown above is the team goal scoring. If you were to look at the first graph above, you might think Detroit is doing well because they are not dependent on their top three scorers. However, Detroit is not having a great season. We need to incorporate the average goal scoring to provide additional context and to explore just a little bit more.
Now we are getting somewhere. Tampa Bay (34%), Carolina (38%), Florida (34%), and Washington (33%) are scoring a lot per game and they are getting secondary scoring with the top three scorers accounting for less than 40% of the team’s goal total. Toronto (44%) and Edmonton (43%) are scoring a lot, but are more dependent on their top three scorers. Meanwhile, Boston (50%) is not scoring a ton AND they are dependent on the top three scorers.
Again, this is just a quick exploratory analysis on the concept of secondary scoring and would need a much more thorough and complete analysis to draw any conclusions, but it is something to ponder during the playoffs.
As the Seattle Kraken hockey operations team looks toward the Expansion Draft, the age of each NHL player will factor into their selections. On Saturday, we posted a broad look at the average player ages of NHL teams, but that just scratches the surface of understanding how teams are constructed. Today, we take a deeper dive into the ages of players and wrap it up with how this could factor into the Kraken’s selection process for the Expansion Draft.
Average age by position and line
Let us start by looking at the median ages of NHL players by position and how they stack up on depth charts.
A couple interesting points to call out here. First, the youngest line in hockey tends to be the first forward line with a median age of 25.8 years old. Conversely, the oldest line is the fourth forward line. Last, the median age of goalies is older than any of the forward or defense lines. This makes sense, since goalies typically take so much longer to develop than skaters.
Average ages by team and line
Here are a couple fun call-outs when looking at this data:
The Vancouver Canucks have the youngest forward line in the NHL (21.8), which is their first line: Elias Pettersson (21.9) Nils Hoglander (19.8), and Brock Boeser (23.6).
The Jets have the oldest forward line in hockey (34.2), their fourth line: Nate Thompson (36.0), Mathieu Perreault (32.7), and Trevor Lewis (33.7)
The Ottawa Senators have the youngest team across all positions with an average age of 25.5 years old.
Washington has the oldest team in the NHL at 31.0 years old. Thank Zdeno Chara (43.5), Craig Anderson (39.4), and Alex Ovechkin (35.0) for driving the age up for the Caps.
The Avalanche have the youngest defensemen in the league, averaging just under 23.9 years old.
Here is a data visualization you can use to dig into the detail of age distributions by team.
Seattle thoughts
Player age alone will not be a deciding factor in the Kraken’s selections in the upcoming NHL Expansion Draft this summer, but it will be a component in some of the decisions to be made. An important piece in incorporating a player’s age in the decision-making process is how many years are left on a player’s contract. How might the players contributions decline over the remainder of the deal?
Example:
Dustin Brown has 11 goals and six assists in his 20 games in the NHL this year and will turn 37 in November. Brown has only one year remaining on his contract with a salary cap hit of $5.9 million per year.
TJ Oshie has five goals and nine assists in his 20 games in the NHL this year and will turn 35 in December. Oshie has four years remaining on his contract with a cap hit of $5.7 million per year.
Both players are expected to be exposed in the Expansion Draft. Even though Brown is two years older, he probably carries the least amount of risk between the two because he only has one year remaining on his contract. In the salary-cap-strapped era the NHL is going through, Brown would probably be more tradeable at the trade deadline next season since teams only need to fit his salary in for the remainder of the year.
The Kraken will also need to evaluate players that are just entering the NHL to forecast what their upside might be. In San Jose, both Dylan Gambrell and Alexander True should be exposed in the Expansion Draft. Both play center. Gambrell is one year older than True and has been a regular in the Sharks lineup this year. True has played this season in the AHL and has five points in six games. They seem to have very similar capabilities, but does the one-year age difference change any of the NHL projections for either player?
For this week’s Data Dump Saturday, I investigate the ages of players in the NHL. Age will be one of the critical factors the Seattle Kraken will need to consider when drafting players in the Expansion Draft this summer. I thought this would be a good topic to dig into to help understand how most teams are built in the NHL.
Average age of NHL players
As you can see, the average age of NHL players has changed over time. Before you make any assumptions about the average age getting older the last few seasons, keep in mind the last two seasons are tough to evaluate as a comparable of the prior seasons.
Last year’s regular season was cut short by a month. The last month of a season is a time where teams tend to call-up their prospects from the AHL or possibly get their major junior and college prospects some games if their regular season has ended. These players will be younger and therefore drive the average age down a bit.
This season is obviously incomplete, so it does not have the late-season call-ups accounted for either. The shortened training camp and elimination of the pre-season also prevented coaches and general managers from getting a look at some of the younger prospects. So those guys may not have had the same chances at making NHL rosters out of camp.
Average age of NHL players by position
Nothing too surprising here other than it really illustrates that goalies tend to break into the league much later compared to other positions. Ilya Sorokin, Kevin Lankinen, and Ville Husso all made their NHL debuts this season and all of them are over 25.
Average age by team
Everyone seems to enjoy looking at the average age by team, so here you go.
Zdeno Chara (43.5) and Craig Anderson (39.3) are inflating the Capitals numbers a bit, but even when you look at the median, they are still the oldest team in the league.
Of course average age does not tell the whole story, so I plan to dig into this a bit more over the next few days to help paint a better picture of how ages come into play when building rosters.
As always, let me know if you have any thoughts, questions, or suggestions for Data Dump Saturday. Enjoy your weekend.
In his 369th career NHL game, Connor McDavid registered his 500th point to tie Sidney Crosby as the eighth-fastest player to reach that milestone. This week on Data Dump Saturday I plan to visualize McDavid’s scoring pace.
I grabbed the game logs from a sample of former and current NHL players to showcase how they stack up. The list of players is relatively arbitrary so if you have complaints about who is included or not included, please file them with Sound Of Hockey’s complaint department.
Average NHL points per game
This next chart is a little noisy but I wanted to look at a points-per-game average over time to see pace and any drop-off. It’s hard to pick the perfect number for the moving average, but I settled on 50 games. That felt like the right number to showcase how these players were performing at various stages in their careers.
A couple interesting points that might be worth exploring:
Draisaitl (bottom orange line) started relatively slow. His spike is probably related to playing with Connor McDavid.
Ovechkin has been surprisingly consistent over his last ~800 games, hovering around the one-point-per-game mark.
Gretzky’s decline was slow and consistent, but he still ended his career at an impressive one-point-per-game pace.
By contrast to Gretzky, Crosby’s point production has declined significantly in the last ~300 games.
Milestone pace
I also took a quick look at how quickly these players hit each 100-point milestone leading up to 500. Numbers in the chart below represent how many games it took to hit the next notable plateau.
By now it seems pretty clear that comparing any of the current players to Lemieux or Gretzky is futile, but one thing that pops is that McDavid is increasing his pace of scoring. Ovechkin also had a relatively short time between 400 and 500 points with just 59 games.
That is another edition of Data Dump Saturday. If you liked this one, you might like my post on scoring across the league. Feel free to send me any suggestions or questions to John@NHLtoSeattle.com.
It seems like every season we hear the narrative that goal scoring in the NHL is up year over year. Instead of taking someone’s word for it, I like to dig into it to A) see if it is true and B) identify changes at the individual team level.
As you can see above, scoring is up but only slightly from 6.07 goals per game last year to 6.12 this year. Heading into this season, there were a lot of questions around the long downtime for the seven teams that did not qualify for the NHL Playoff bubble last summer, shorter training camp, and the lack of pre-season games possibly impacting the scoring in the league this year. Those factors might have an effect on the games in some manner but at this time it seems to be immaterial to draw any conclusions based on scoring.
Scoring by NHL Team
There might not be a material change for the league at large, but there certainly are changes in scoring by individual teams. Here is a rundown of the scoring change year over year by team through Friday’s games.
Margin of victory
Another broad metric I like to look at is the ‘average margin of victory’ in games. The general consensus is that the smaller the margin of victory, the better the game, and I tend to agree. Let us take a look.
As you can see, the games are closer this year compared to last year and a heck of a lot closer compared to the 2018-19 season. It will be interesting to see if this trend continues through the rest of this campaign or if it is just an early season blip.
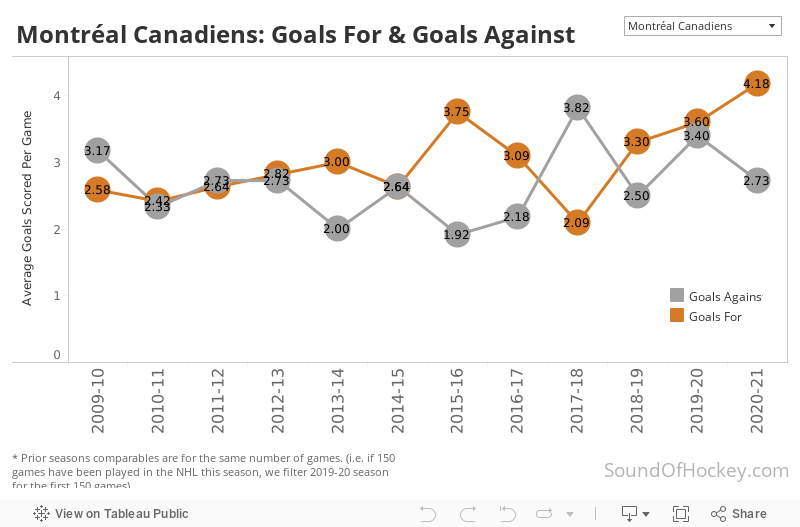
Goals for and goals against
Of course goal scoring is one thing, but goals against is another important factor in how teams are performing (just ask the Vancouver Canucks). If you want to look at individual teams’ performances over time in the ‘goals for’ and ‘goals against’ categories, I’ve created an interactive visual below.
It is too early in the season to draw any hard and fast conclusions, but it will be something we keep an eye on as this shortened season progresses. If you have any questions or data requests, message us at the @Sound_Hockey twitter account.